Computer processors can get damaged or crash when they get overheated (e.g in a stress test). The following free tools (and 1 paid) allow you to avoid this problem by monitoring the CPU temperature in your Windows PC or laptop.
So, in this post we’ll go over some popular and reliable CPU temperature monitoring tools for windows computers. The list below is in no particular order.
#1 Core Temp
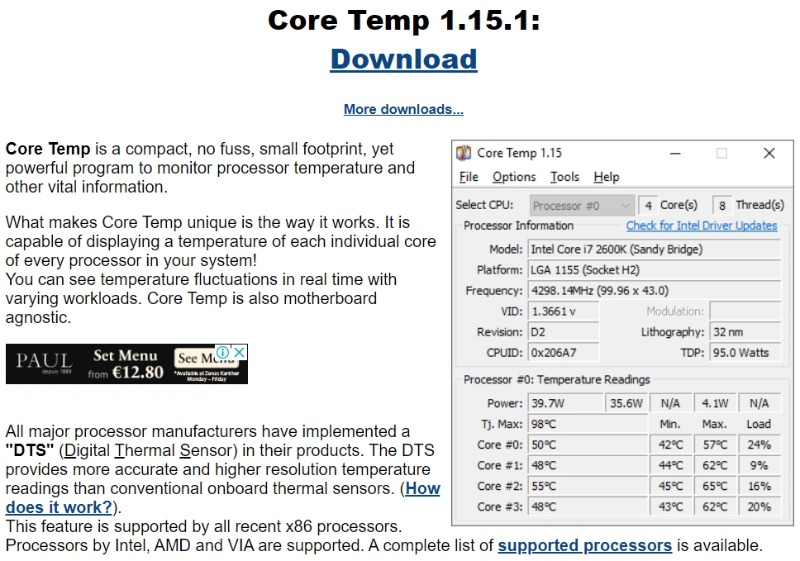
Core Temp is a lightweight, easy-to-use temperature monitor for Windows computers. It works with most processors and displays the temperature for each individual core. You can also view other basic system information such as the processor model, platform, and frequency.
The application displays the temperature in real time and does not use a lot of resources. You can leave it running in the background without slowing down your other programs.
Note: You might need to click on ‘show hidden icons’ in the task bar to see the temperature for each core.
Besides the basic Core Temp program, users can install add-ons to increase its functionality. For example, there are several add-ons that allow you to remotely monitor the CPU temperature from another device.
The developer of Core Temp also released mobile versions of the application for Android and Windows Phone devices.
#2 Speed Fan
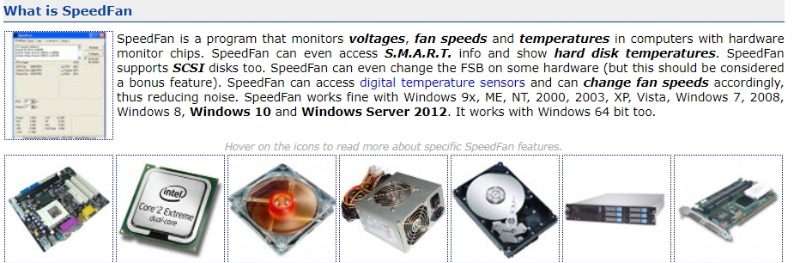
Speed Fan offers convenient CPU temperature monitoring and several other useful features. Besides the CPU temperature, the program also displays the temperature of the system, graphics card, and individual cores in a multi-core processor.
It works on all versions of Windows from Windows 95 to Windows 10. Speed Fan also supports both x86 and 64-bit processors.
With this application, you can view and control fan speeds for compatible processors and motherboards. You can reduce the speed of the fans until you no longer hear extra noise. When the program detects high CPU temperatures, it automatically raises the speed to 100%.
Advanced users will also find a variety of features and data for monitoring their systems, including access to SMART hard drive info and hard drive temperatures.
#3 HWMonitor
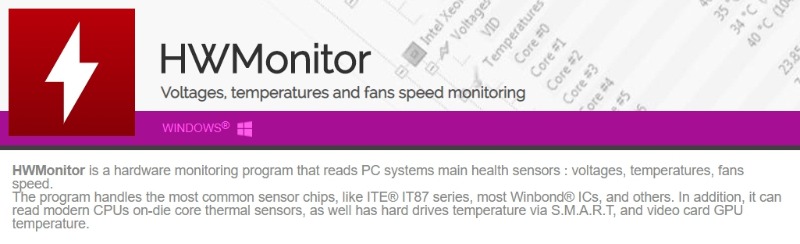
HWMonitor is a detailed hardware monitoring program from the developers of the popular CPU-Z freeware software. It works with both 32-bit and 64-bit processors and receives frequent updates for continued support with the latest CPUs.
Users can download an installable version of HWMonitor or a non-installable version in a ZIP folder. The installable version adds HWMonitor to the start menu while the ZIP folder allows you to run the program without installing.
The program reads the various health sensors inside your system. You can view the temperatures of the CPU, hard drives, motherboard, and graphics card. You can also monitor the voltage, fan speeds, and SMART info.
There are two modes for monitoring the CPU’s health. You can either choose the summary-only mode or opt for sensors-only.
The sensors-only mode gives you a long list of details that tell you about the system’s health. While all the information mentioned in this monitor is useful, the mode is not ideal for use during gaming. In such scenarios, you can use the summary-only mode.
Overall, HWMonitor is one of the most reliable, lightweight temperature monitors for Windows PCs.
#4 Real Temp
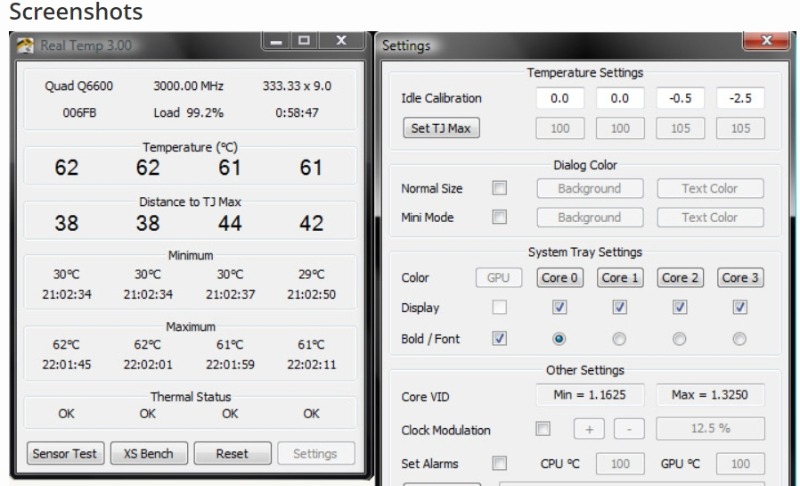
Real Temp provides a streamlined view of the CPU temperature, including the temperature for each individual core. However, it only supports Intel Core-based processors. It will not work with AMD processors or Pentium 4 processors.
If you have an Intel Core processor, you can install this program on a Windows PC running Windows 2000 to Windows 10. It also works on both 32-bit and 64-bit processors.
Real Temp includes a few features for improved temperature monitoring. It logs the minimum and maximum CPU temperatures, uses test sensors, and includes a high-temperature alarm and shutdown feature.
While Real Temp does not display additional system info, it offers a simple method for viewing the CPU and GPU temperatures.
#5 AIDA64 Extreme

AIDA64 Extreme is a comprehensive hardware detection engine designed for power users. People who like to overclock their computers may enjoy the advanced diagnostic functions of this program.
Users can download and install a free 30-day trial of AIDA64 Extreme. However, the full version is a paid program. While this is not a free program, it provides the greatest range of features for monitoring your system.
You can view the temperature of each component along with the memory read, write, and copy speeds. The program also displays detailed information for running applications, helping power users determine the best settings for overclocking.
AIDA64 Extreme is compatible with all modern 32-bit and 64-bit versions of Windows, including Windows 10.
#6 Open Hardware Monitor
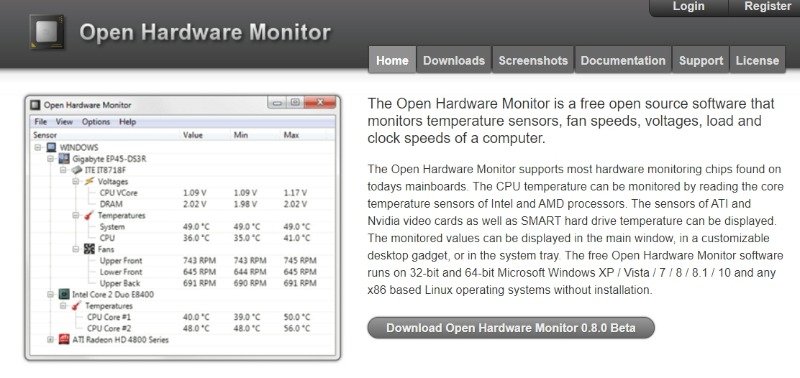
Open Hardware Monitor provides a simple interface for monitoring temperature sensors, voltages, fan speeds, and the clock speeds of your computer. It also displays SMART hard drive info.
This program is compatible with 32-bit and 64-bit Windows PCs, including all versions from XP to Windows 10. You can also install it on x86-based Linux operating systems.
One of the benefits of this program is that it works with both Intel and AMD processors. It also supports ATI and Nvidia graphics cards.
Open Hardware Monitor is an open source project, which means that other developers can use the source code for their own projects. It also does not require installation. You simply download the ZIP folder, extract the files, and run the program with Administrator rights.
#7 CPU Thermometer
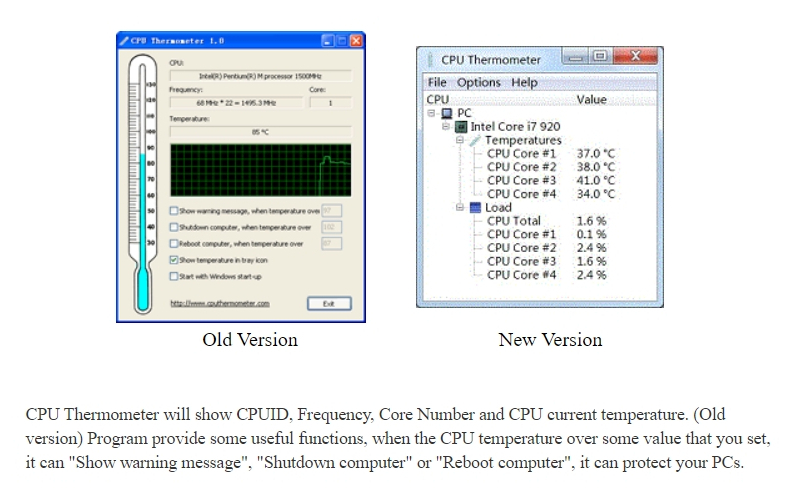
CPU Thermometer is a lightweight monitor that works with most Intel and AMD processors. It also supports 32-bit and 64-bit Windows operating systems including Vista, 2008, 7, and 10.
The latest version includes a basic list of the CPU cores and their temperatures along with the total CPU load capacity for each core. You may also choose to display the CPU temperature in the system tray instead of needing to leave the window open.
CPU Thermometer also provides a few basic options. You can set a maximum CPU temperature. When the temperature reaches the max value, you can choose to display a warning message, shut down the computer, or reboot the computer.
#8 Speccy
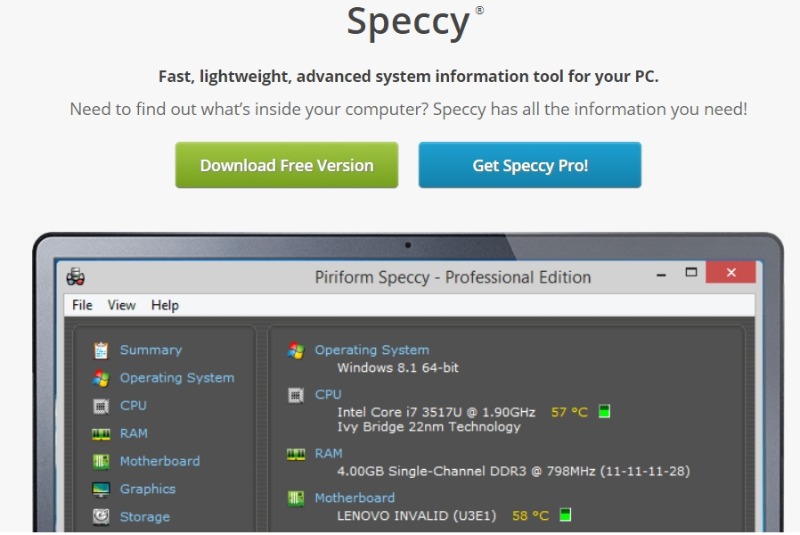
Speccy is a free PC monitoring program from the developers of CCleaner. It displays detailed system info related to the CPU, RAM, motherboard, operating system, graphics card, storage disks, and other hardware. You can also view the temperature for key components including the CPU and motherboard.
Speccy can also be used to create detailed reports. You can view the performance of your hardware over a set period. The program is not as lightweight as some of the other options. However, it offers more information about the type of hardware installed in your computer.
Besides the free version of Speccy, the company offers a premium version with customer support and automatic updates. There is also a bundled package that includes Speccy, CCleaner, Recuva, and Defraggler.
#9 Enhanco Free
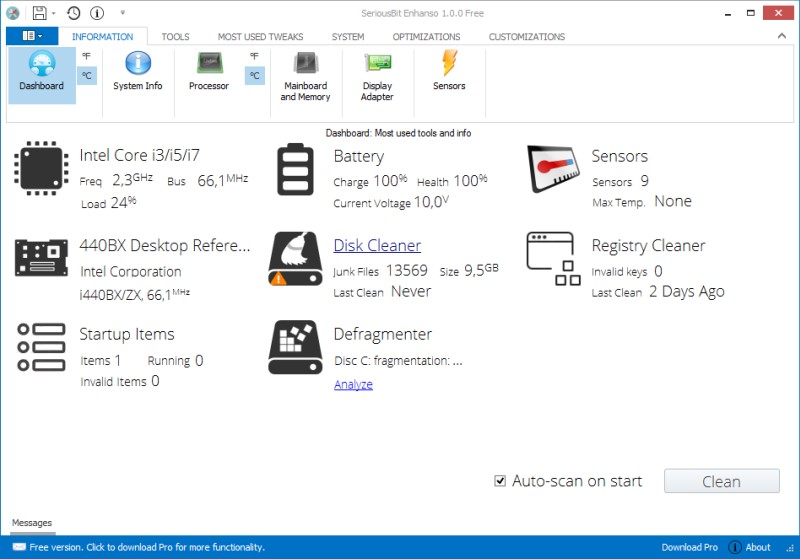
Enhanco is a general tweaking tool for Windows. This tool has its history going back to Windows XP but the developer created new versions since then to cover Windows version Vista, 7, 8 and now Windows 10.
The tool can help you with tweaking a multitude of hardware and software components on your computer such as security, disk cleaner, defragment, registry cleaner etc. Among these features, it offers also system monitoring such as CPU temperature, CPU speed frequency, RAM information etc.
#10 HWiNFO
Last but not least is HWiNFO. This Freeware app will provide more information about your computer than you will ever need, including ofcourse temperature of your CPU.
It runs on all Windows operating system versions (from Windows 98 up to Windows 10) and supports monitoring of literally hundreds of different hardware components, from CPUs, Graphics cards and Chipsets.
What I like about this software is that you can customize alerts and get notifications on any parameter monitored, plus you can get reports and integration with external and 3rd party add-ons and extensions.
For a freeware app, it is one of the best in our list.
#11 NZXT CAM
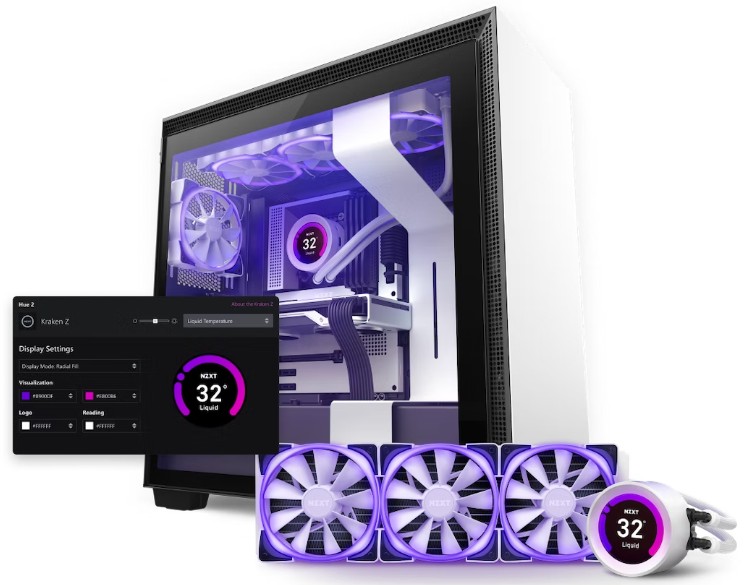
With NZXT CAM, you get real-time temperature monitoring for your PC. This is perfect for gamers who plan for hours-long playtime or anyone who uses their PC extensively in one sitting.
Besides tracking CPU/GPU temperatures, NZXT CAM also monitors other areas such as CPU/GPU load, Current FPS, and time played. You can even customize with CAM, sync up with your lighting, or integrate with IFTTT for a smart home connection.
For greater control, use Smart Scheduling to customize how your fan reacts throughout the day. Shut lights off automatically at specific times, or design it so that the cooling system increases or decreases whenever you need it to.
#12 PAESSLER
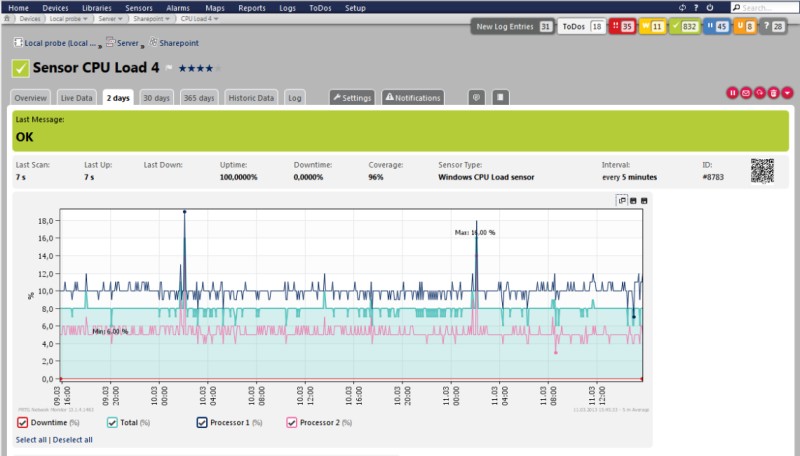
PAESSLER offers a free version of PRTG Network Monitor to help you keep track of your system’s performance. Based on the setup of your hardware, this can monitor CPU temperature for you with ease.
Even if your PC doesn’t allow for temperature monitoring exactly, this program can still keep you aware thanks to the fact that it monitors CPU memory load. Checking this will let you know if anything is overheating.
Beyond that, the sensors of PRTG in the network are ideal for measuring several features such as memory, bandwidth usage, servers, and routers. You can stick to the free version that’s limited to 100 sensors or pay for the full version for all features.
#13 SIW (System Information for Windows)
SIW is a paid-for program that monitors not only CPU temperature, but also software, hardware, and network information.
An advanced analyzing tool, this can create a report in several file types (e.g. HTML, TXT, CSV), making it easier to keep track of everything.
Other than your CPU, SIW helps you track areas like motherboards, memory, network adapters, video card, sound devices, operating systems, certificates, open ports, connections, and plenty more.
There are three different versions of the program you can purchase. It all depends on how much monitoring you need.
How to Reduce CPU Temperature
There are many ways to fix overheating problems. You can use simple techniques such as dusting the CPU fan, using a more powerful air cooler fan on your CPU or applying new thermal paste.
Since liquid cooling is more effective at transferring heat compared to air, liquid cooling can reduce the CPU temperature by 50-60 °F (10-15°C).
Although not every CPU requires liquid cooling, air cooling can overheat the CPU if it doesn’t match the CPU’s requirements.
For instance, if you are using a 150W air cooler in a CPU that requires 200W, then the CPU will overheat and throttle. Besides liquid cooling, you can use any of the following simpler techniques to lower and maintain normal temperature for CPUs:
- Don’t do overclocking if not necessary.
- Improve airflow inside the case.
- Put your computer in a cold environment.
- Clean your computer regularly to get rid of dirt and dust.
- If you have a defective fan or heatsink, replace it.
- Apply thermal paste on CPU and heat sinks.
- Close unused background programs.
- Buy cooling pads for your laptop.
Closing Words
You cannot go wrong with any of these options. All of these programs are free (or offer free-trial) and easy to use on any Windows PC. Install one of these CPU monitors today to keep an eye on your CPU processor because it’s one component that its health is vital for your computer system.
HWMonitor doesn’t show the fan speed!!
Falk, thanks for your comment.
According to the developer it reads the fans speed as well. Have a look here: https://www.cpuid.com/softwares/hwmonitor.html
Thanks
You totally omitted the best tool – HWiNFO
You are totally right. I’m including this as well.
Thanks for the heads up.
One of important features of “monitoring” tool is an ability to log the results into a file. If you are running a long benchmark (say, SPECworkstation, about 5 hours to complete) and want to know which sub-bench causes elevated temperatures, you can’t sit 5 hours and “monitor” the temperature on screen. I spent several hours to find a soft that can do this – it appears to be the (#1 rated) CoreTemp, and no other soft can do this. The HWiNFO (v6.22) allegedly can do .csv log, but you can’t configure anything for the dump, it dumps ALL the info, and the logged temperature readings are all bogus, there is some bug. While the HWiNFO looks nice, it needs some serious work.
The CoreTemp would also benefit from some improvement in logging capabilities, to have some config options to reduce the amount of useless information like “min” and “max” temps for each core.
It would be nice if this review would include information about logging capabilities of these tools.
Hey Alex, thanks for stopping by and for your comment. Indeed you have a valid point here about logging capabilities. Thanks for the suggestion.
Open hardware monitor does NOT show temperature of most modern intel cpu’s.
Thanks for your comment. Maybe the newest CPUs are not supported yet by the software.
Logging capabilities of HWiNFO has been significantly improved in recent versions. Now it’s also possible to choose which items will be logged.
I don’t do gaming unless it’s on a wood, metal & flashing lights pinball machine so IMHO don’t need super-duper processing power (let alone a discrete Video Card). Being an antique myself, I run an appropriate AMD A8-5500 from the mists of time (well, 2013 actually). At times it was running up to 98 deg.C (208 deg.F), when max. recommended was 73 deg.C. Used Speccy or HWM to check – identical readings. Took the side off the (tower) PC and let a 12″ desk fan blow the cobwebs away & try to cool things down, but to no avail. Decided to use Windows10 Power Management to limit the CPU clock to 85% (3,200Mhz to 2,700Mhz). Fingers crossed, but seems to have done the trick and no noticeable slowness in response doing things like spreadsheets, playing or steaming videos (i.e. what I use this PC for). This may be a tip to add to your list of things to do to reduce CPU Temperatures. Thanks for the Top 10 list – very useful info. Cheers – Jerry
Hi Jerry.
Thanks so much for your feedback. Yeah, the Windows 10 CPU clock limitation will help a lot, although many “hard core” gamers actually try to overclock the CPU instead of slowing it down.
Regarding taking off the side of the tower, I have also tried something similar but actually it made things worse. Computer cases are designed in such a way as to distribute air flow efficiently within the case, so by removing the side it actually makes things worse.
i looooove OpenHardwareMonitor its portable easy and fast .. just 1 mb .. simply the best.. and support my cpu i5 8300H and my gpu nvidia gtx 1050 ti max q there is no problem … thank you so so much
Thanks for you feedback Mohamed, really appreciated.
Although this is a bit of a ‘necro’, I should note that SpeedFan has not been updated in years, and it does *not* support any of the AMD Ryzen processors. That was a disappointment for me when I recently upgraded to the Ryzen 7 3700X, because I’ve used SpeedFan to monitor my system for many years, but it is now no longer an option.
Daniel, thanks for the feedback and the heads-up.
Have a nice day
Harris
Nice article Harris, you may also want to note that in addition to its logging options, Open Hardware Monitor has the facility to serve the monitor data to a webpage, with an included webserver on a user configurable port allowing machine/machines temps to be monitored remotely.
Vee, thanks for your feedback.
To be honest, I didn’t know what you mentioned about Open Hardware Monitor. Thanks for the info.
Harris